Every other vital sign has a non-invasive sensor. Hydration doesn't — yet. Three model generations, 76 participants, and 150+ test sessions later, we've crossed a critical threshold: passive, personalized binary classification of hydration state, validated in leave-one-subject-out cross-validation across a demographically diverse cohort. This is what it takes to build a measurement category from nothing.
76
Unique participants tested across three model generations
11+
Distinct cultural and ethnic backgrounds represented
1.5M+
PPG data points collected under ground-truth conditions
0.3%
Weight-scale accuracy for ground-truth hydration change
01
Every vital sign has a sensor. Hydration doesn't.
Heart rate has the pulse oximeter. Blood oxygen has SpO₂. Glucose has the CGM. Temperature has the infrared thermometer. Hydration — arguably the most volatile variable in human physiology — has urine color charts, thirst perception, and the occasional blood draw. None of them is accurate, seamless, or reliable across populations.
Aqoir is building the missing sensor. The approach is photoplethysmography — the same optical technique behind pulse oximetry — combined with machine learning on waveform features that change with tissue hydration. This approach is well-grounded in peer-reviewed research (Kimball 2022, Reljin 2018), but no one has yet shipped it as an accurate, seamless consumer-grade measurement. That's the category we're building.
02
A dataset that reflects the world the device will live in.
Measurement categories are built on diverse data, not convenient data. Our 76-participant cohort spans 11+ cultural and ethnic backgrounds, ages 12 to 81, varied fitness levels, and real-world daily routines. This diversity is deliberate — a hydration sensor that only works for one demographic isn't a sensor, it's a demo. Across three model generations and 150+ test sessions, this cohort has generated the richest PPG-based hydration dataset in the consumer hardware space.
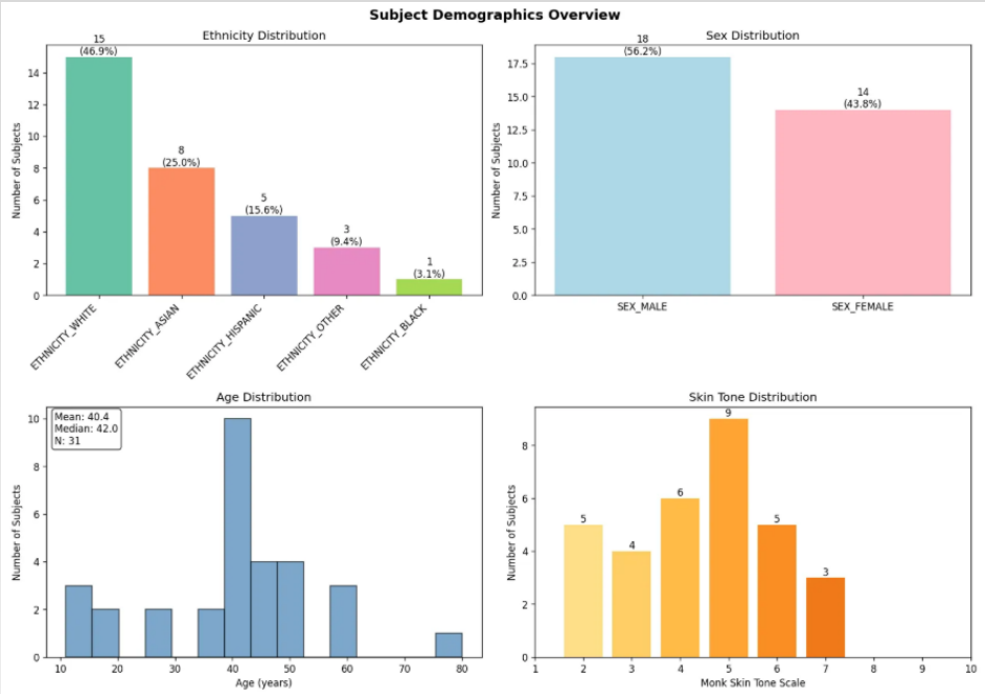
The Cohort
Subject demographics — ethnicity, age, sex, and Monk skin-tone distribution across the 76-participant study.
Subject demographics across the cohort that trained and validated all three model generations. Diverse ethnicity, age span 12–81, and a full spread of Monk skin-tone scale — critical for PPG validity across skin pigmentation.
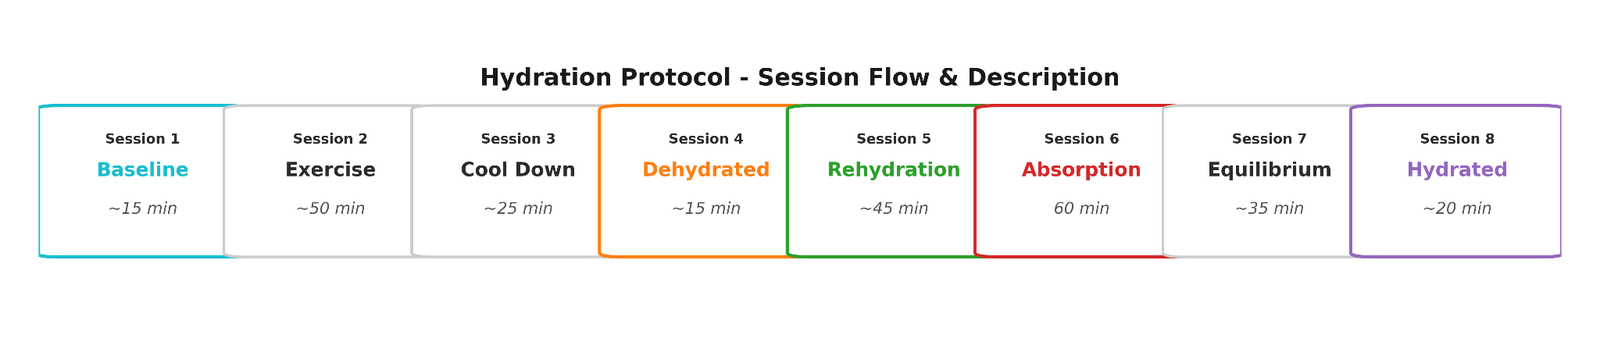
The Protocol
An 8-session hydration protocol that produces ground-truth dehydration and rehydration curves for every participant.
Every participant runs through a structured exercise → dehydration → rehydration protocol. Ground-truth hydration change is measured against weight scale (0.3% accuracy) and urine specific gravity. This gives us precise labels at every time point — the foundation on which all three model generations were trained.
03
v1 Yampa — a working algorithm on consumer-grade hardware.
Our first-generation model ("Yampa") proved something significant: engineered PPG waveform features, processed through a machine-learning pipeline running on non-specialized hardware, can track hydration state across a demographically diverse cohort. 95% of the 60 analyzed subjects showed positive correlation between Yampa's predictions and weight-scale ground truth — strong peer-review-grade validation of the core measurement hypothesis, and the foundation Rio Grande builds on.
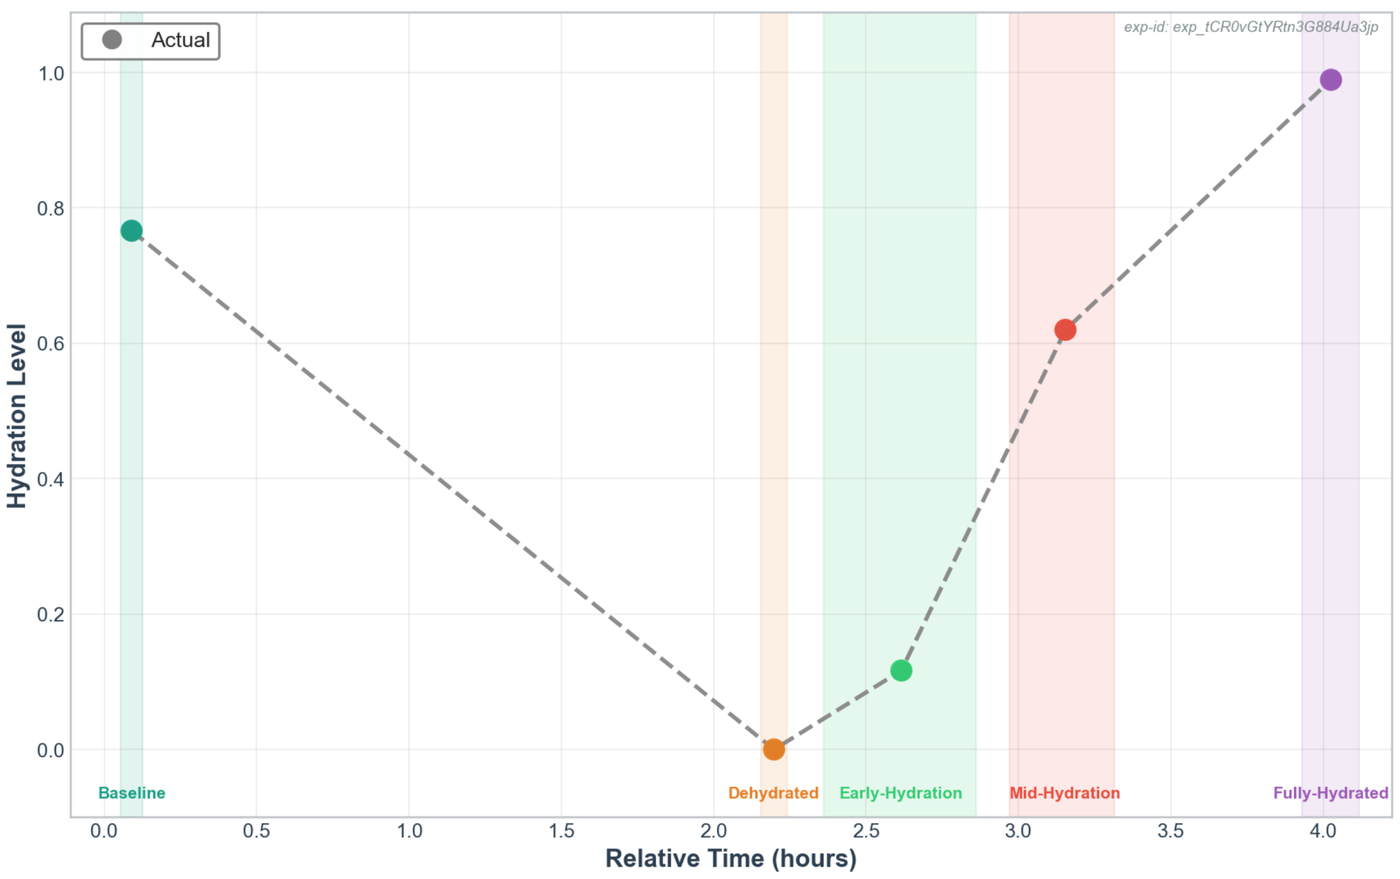
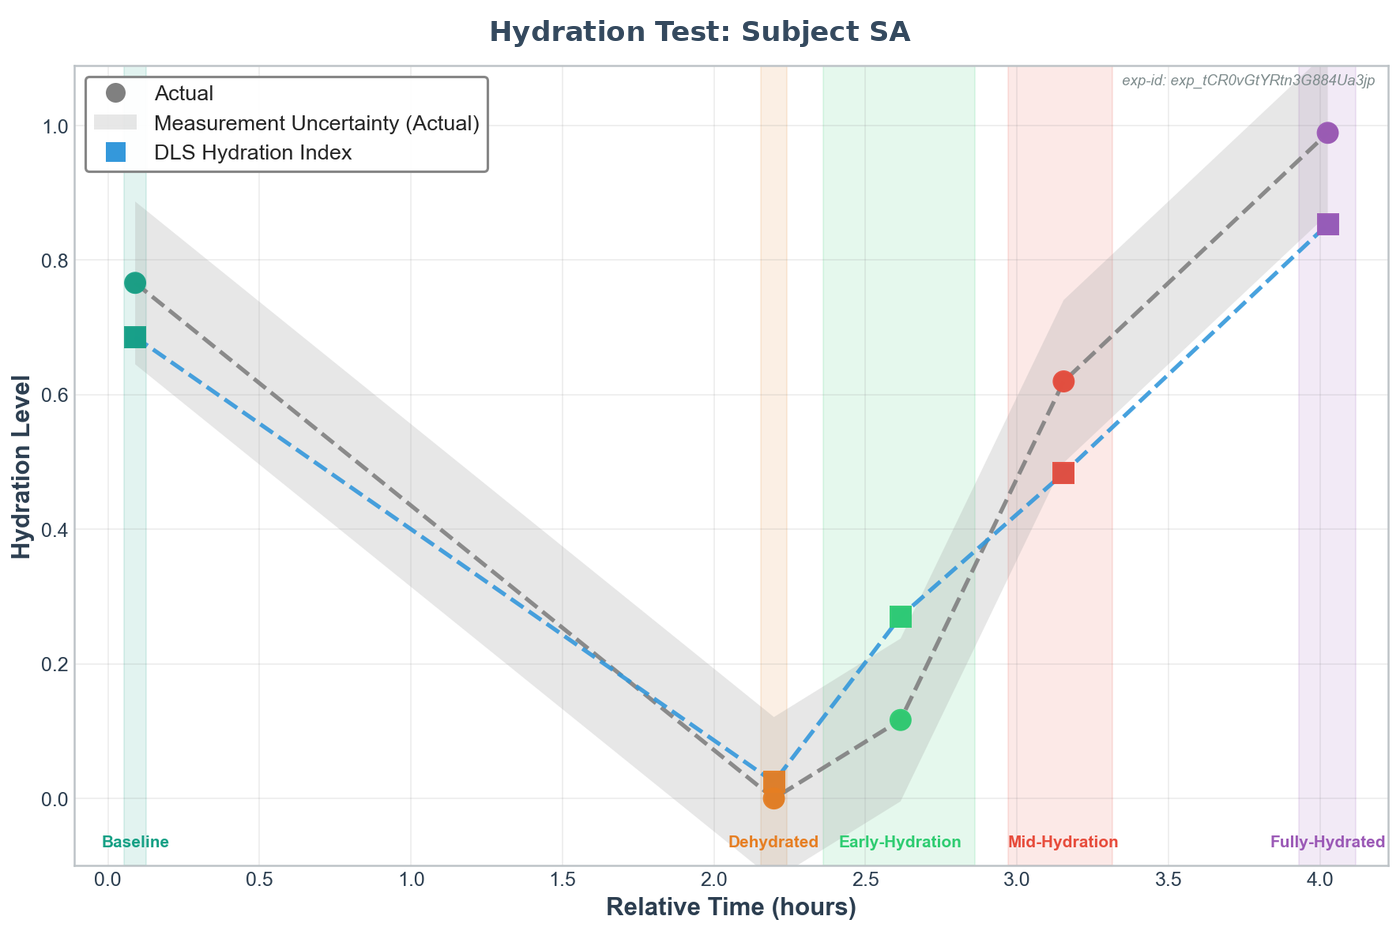
Yampa · Single-Subject Walkthrough
Yampa tracks the dehydration and rehydration curve for an individual participant — here, against weight-scale ground truth with uncertainty bands.
One representative participant's hydration test. The gray line is ground truth from the weight scale; the blue line is Yampa's prediction from PPG waveform features alone. The prediction tracks the full curve — baseline, exercise-induced dehydration, rehydration, and return to full hydration — on consumer-grade optical hardware, not lab equipment.
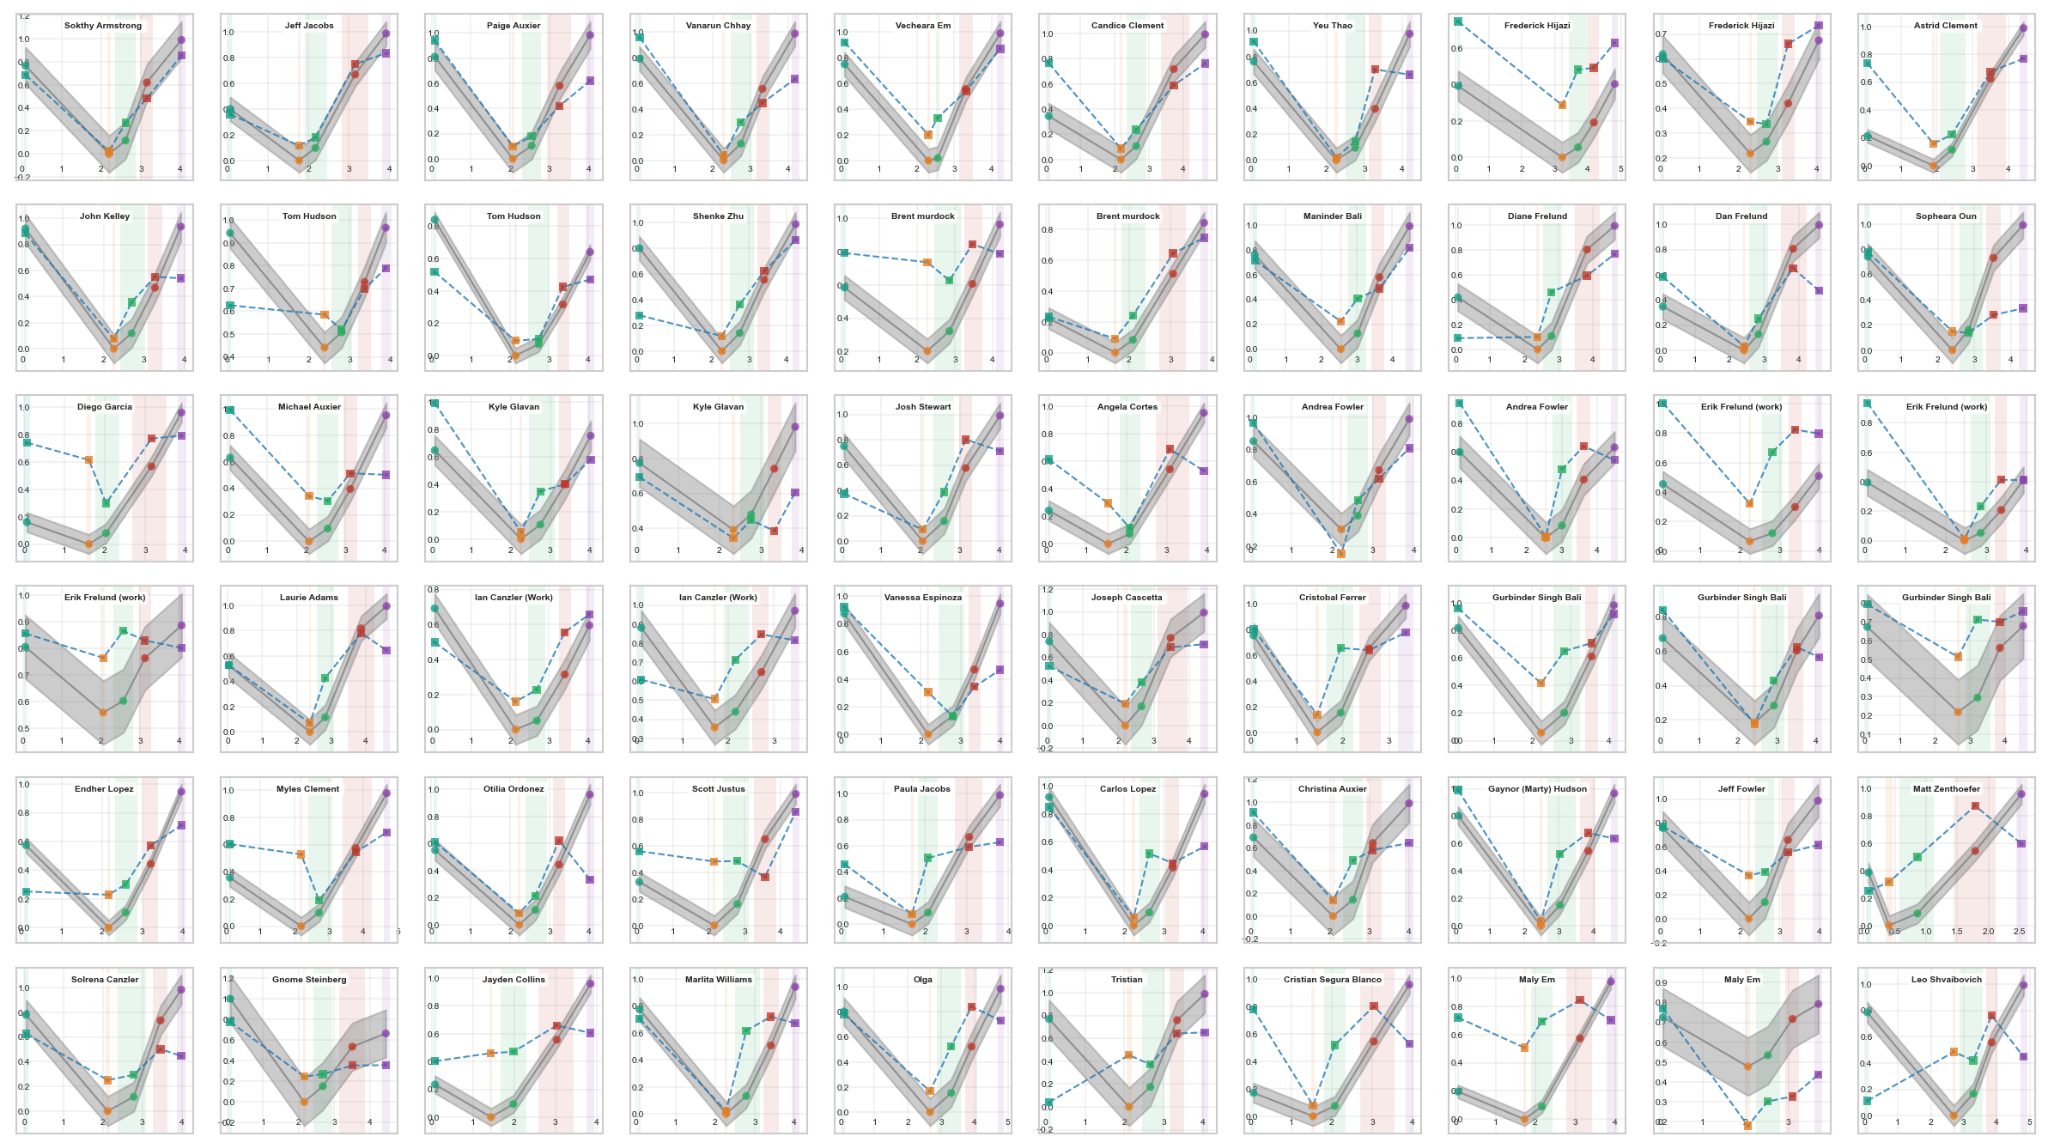
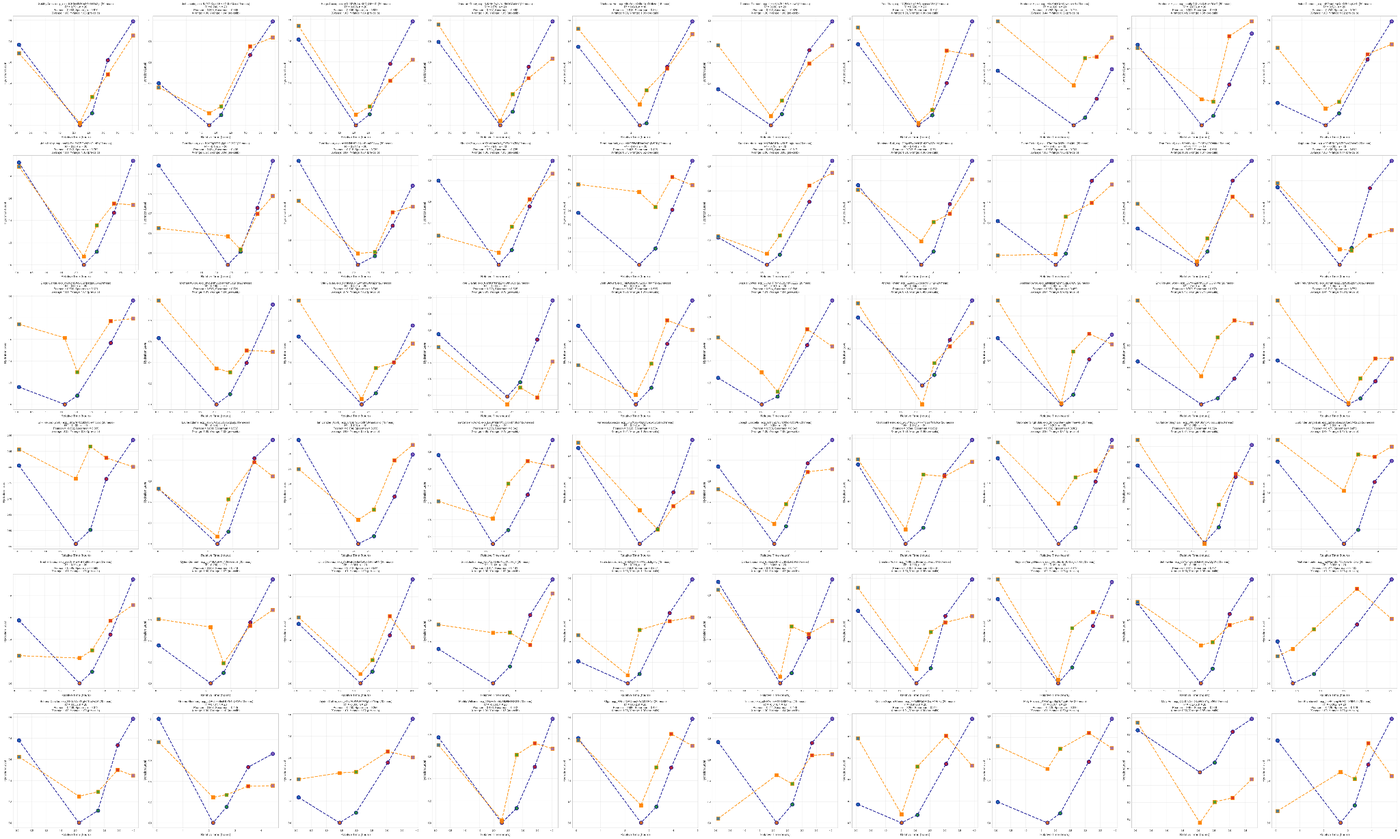
Yampa · Full Cohort
Every participant's prediction vs. ground truth — 60 subjects, validated via leave-one-subject-out cross-validation.
The full Yampa validation — every analyzed subject, each chart showing that participant's ground-truth curve (solid) against Yampa's prediction (dashed). Cross-validation excluded each subject from training before testing, ensuring the model had never seen their physiology before.
Yampa · Correlation Distribution
Trend correlation (Pearson r) between Yampa's prediction and ground truth across all 60 analyzed subjects.
Ranked per-subject correlations. 95% of analyzed subjects (57 of 60) show positive correlation; the majority correlate above 0.7; 25 subjects correlate above 0.9. The three outliers at the bottom were traced to protocol errors and app data-capture issues — not algorithmic failures, but they pointed to where v2 would focus.
Model v1 · Codename: Yampa
What Yampa established
Yampa is the proof point that made the category-creation argument credible. Before Yampa, the question was whether PPG waveforms on a wrist-worn device could track hydration at all. After Yampa, the question became how much better we could make it. The model aligns with the ~88% accuracy result Reljin et al. reported on PPG-based volume status (Reljin 2018) and with the broader Compensatory Reserve framework from US Army + Georgia Tech (Kimball 2022) — giving Yampa external scientific grounding, not just internal validation.
Yampa also surfaced exactly where the next generation would focus: demographic consistency (variance in accuracy across age and ethnicity), temporal stability (some predictions drifted more than the underlying hydration state changed), and harder-PPG robustness (subtle fiducial points on some waveforms weren't being located reliably). Rio Grande addresses all three.
04
v2.1 Rio Grande — the signal becomes reliable.
Yampa answered the first question: the signal exists. PPG waveforms on consumer hardware encode hydration information — measurably, reproducibly, across a diverse cohort. But "the signal exists" is not the same as "the signal is trustworthy." Rio Grande's job was the second question: can we make the measurement reliable enough to build a product on? Reliable across every demographic. Stable over time. Readable even on difficult PPG recordings where the prior pipeline gave up. Rio Grande delivers on all three — and in doing so, makes a third question answerable for the first time.
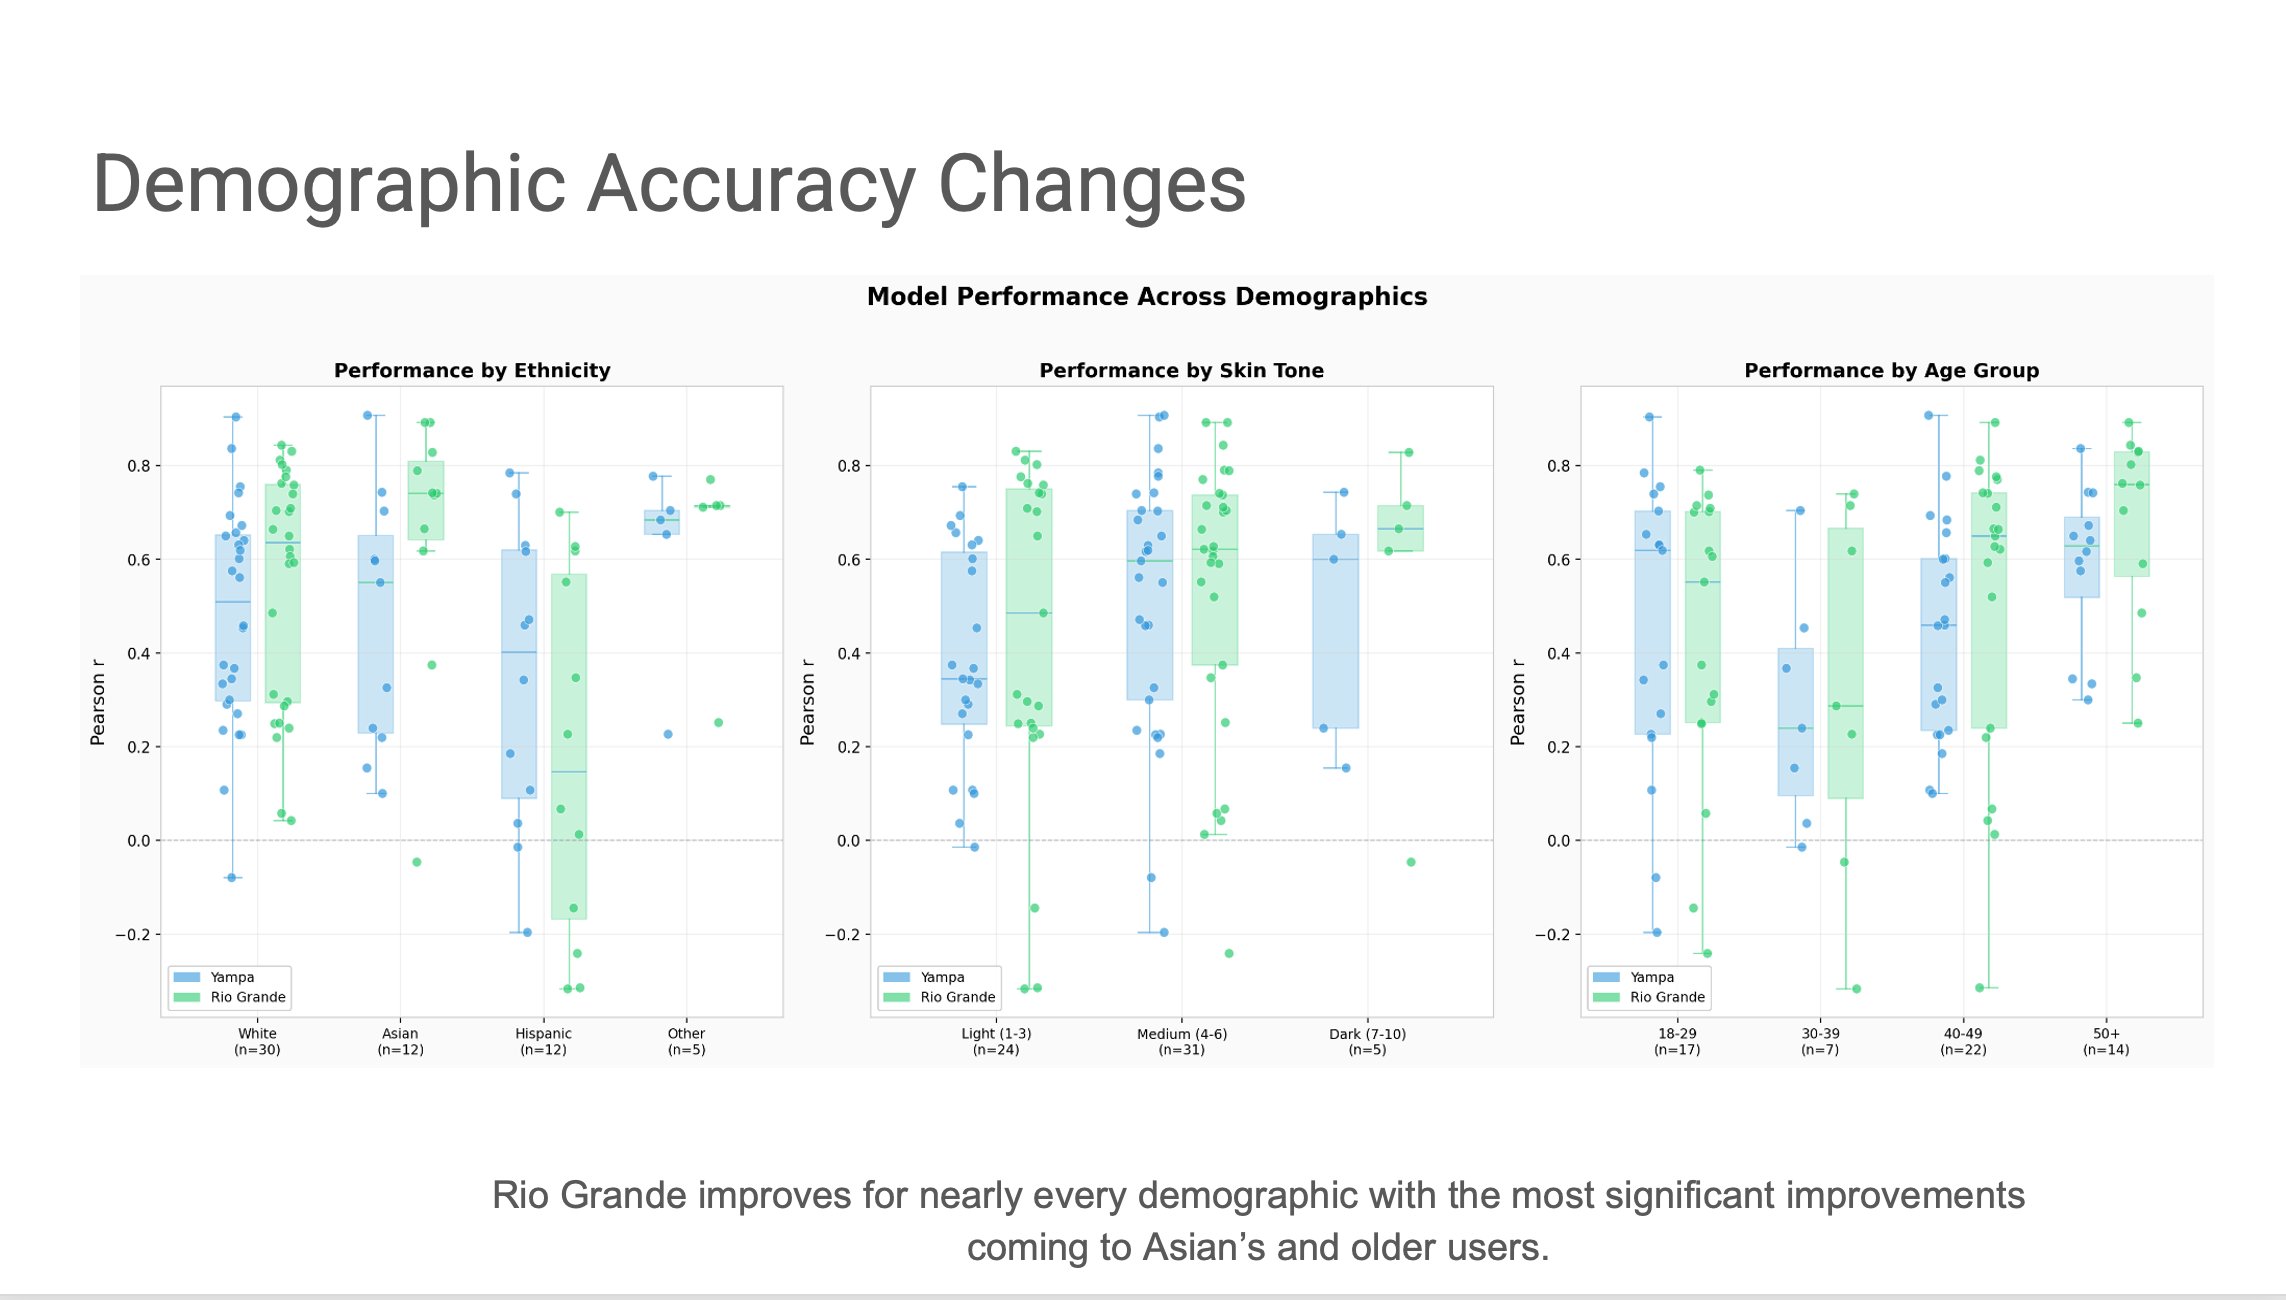
Evidence 1 · Works across populations
Rio Grande improves accuracy for nearly every demographic — with the biggest gains in Asian users and older users, exactly where Yampa had more variance.
Pearson r correlation between model prediction and weight-scale ground truth, across three demographic axes (ethnicity n=59, skin tone n=60, age group n=60). Yampa is blue; Rio Grande is green. A measurement category has to work across every population, not just the easy ones.
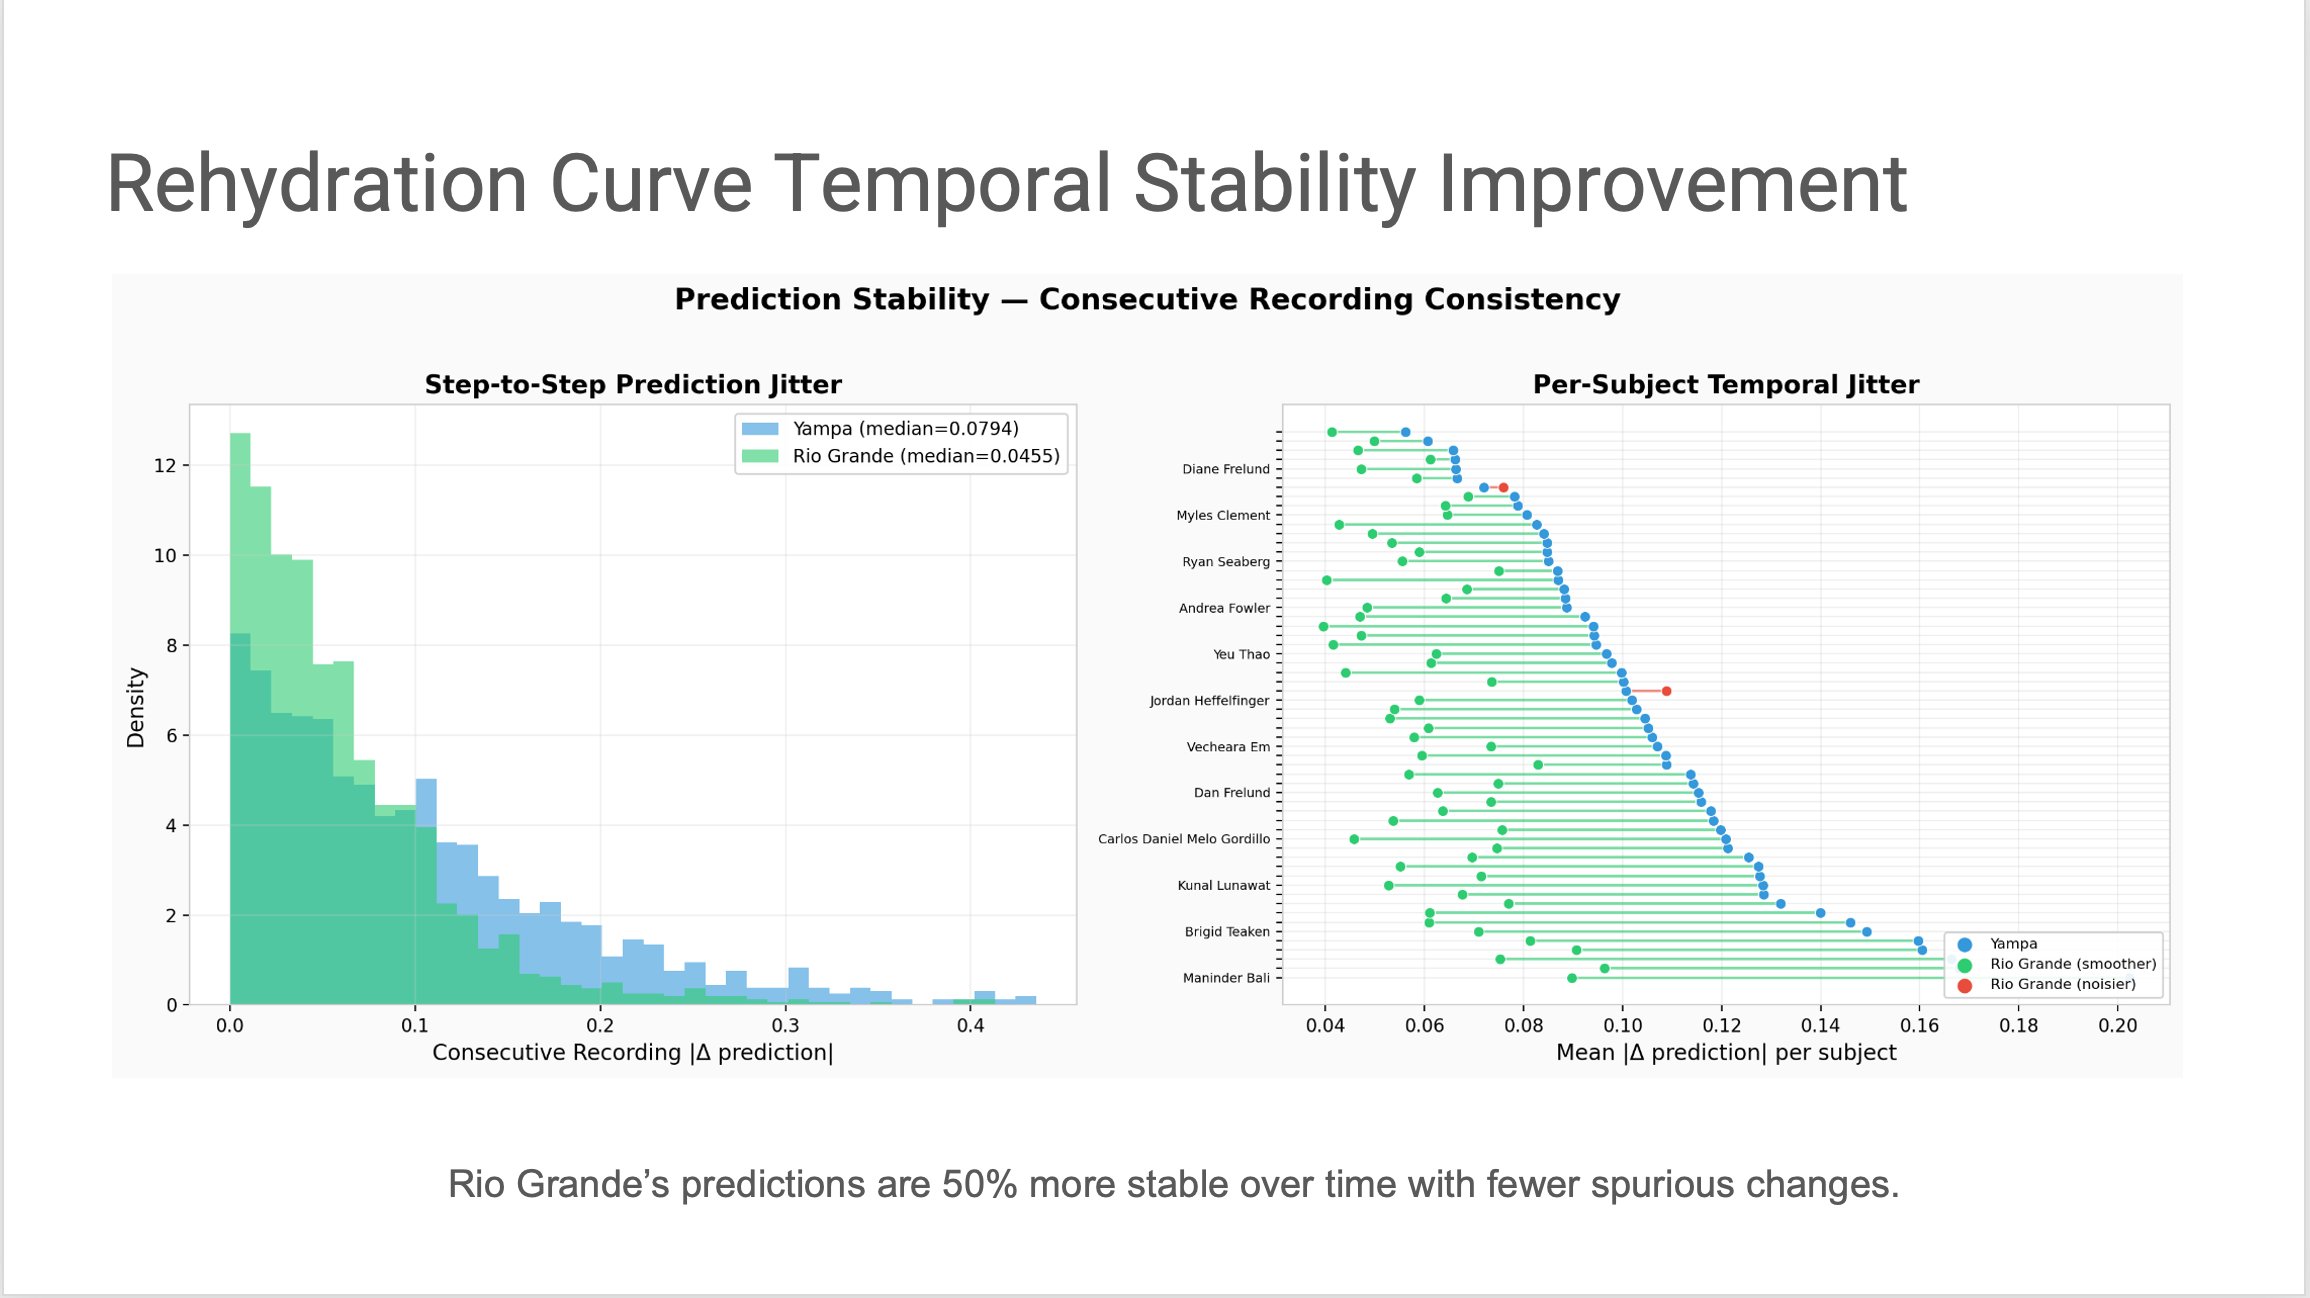
Evidence 2 · Reproducible over time
Rio Grande's predictions are 50% more stable between consecutive recordings — median step-to-step jitter dropped from 0.0794 to 0.0455.
Step-to-step prediction jitter (left) and per-subject temporal jitter (right). Lower is better. A measurement category has to be reproducible, not just correlated — a sensor that reads 72% hydration now and 68% thirty seconds later, with no physiological reason, isn't yet a sensor.
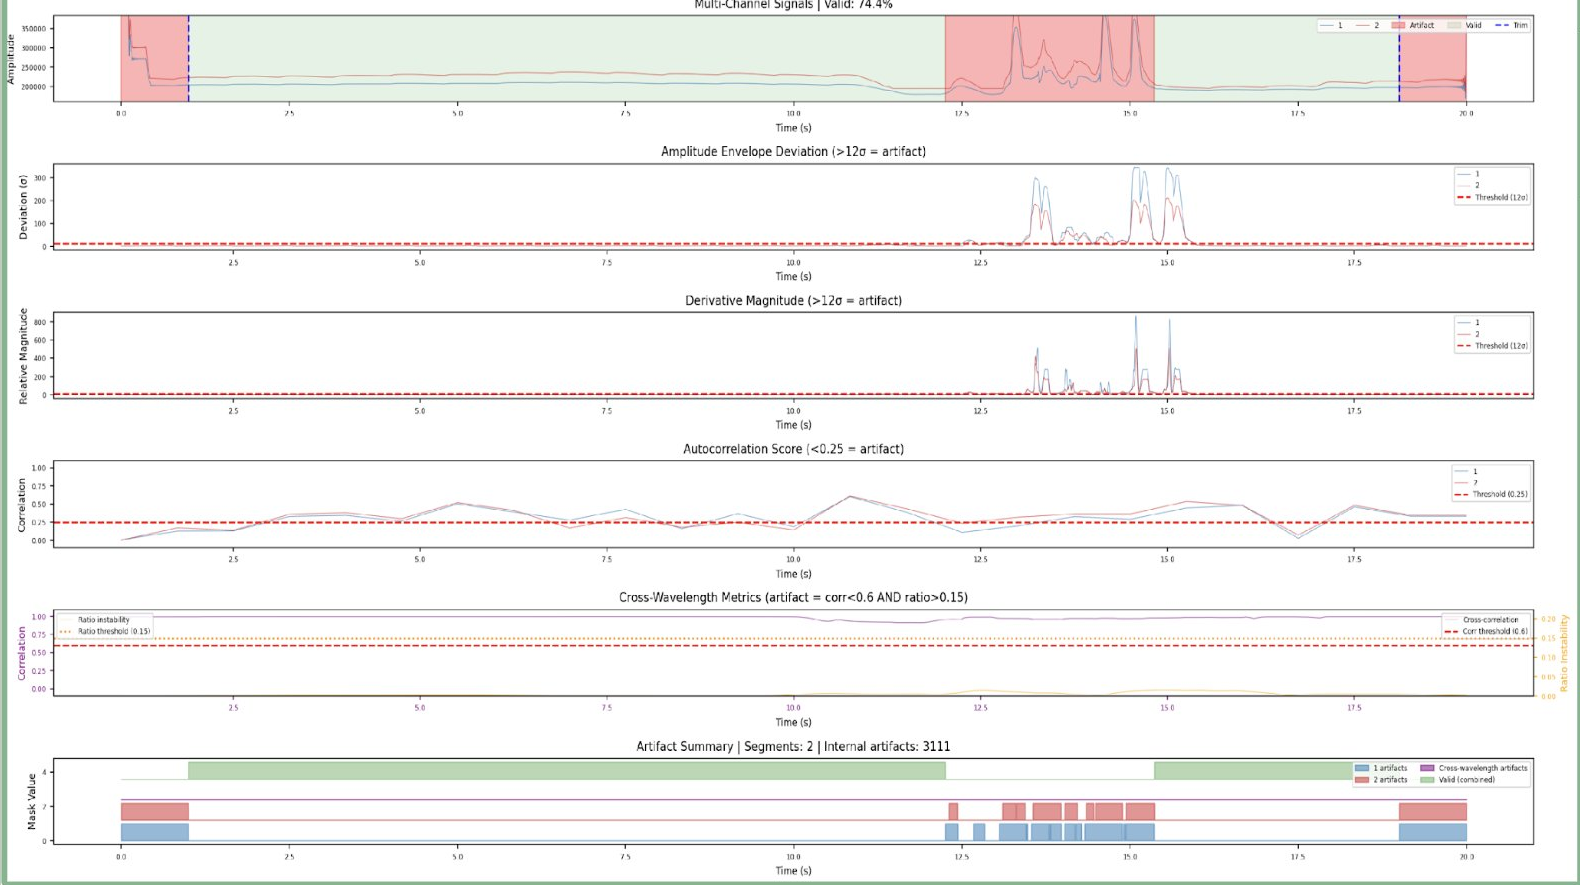
Evidence 3 · Artifact detection you can see
Rio Grande's motion-artifact detection preserves every clean section of PPG signal — while flagging and removing corrupted regions automatically.
A 20-second window of dual-channel PPG recording passed through Rio Grande's artifact-detection pipeline. Four independent detectors — amplitude envelope deviation, derivative magnitude, autocorrelation, and cross-wavelength ratio — each score the signal separately. Their combined output (bottom panel) identifies valid regions (74.4% of the window) against artifact regions (initial settling, motion spike mid-window, and pulse transients at the end). This preserves every clean second rather than discarding whole recordings, which is what lets Rio Grande produce predictions on shorter, real-world captures. — swipe the chart above to see all detector panels.
Artifact detection ensemble
Rio Grande detects motion artifacts using an ensemble of detectors and removes them, protecting downstream analysis from corruption. This lets us work with shorter recordings in more natural conditions.
Multi-resolution pulse segmentation
Twelve signal-preprocessing strategies run in parallel, with results unified downstream. Pulse segmentation failures on difficult PPGs dropped 85–95%.
Higher frequency cutoff
The new pipeline captures signal information up to 12–15 Hz, versus 8–9 Hz previously. Derivative-based features (vascular compliance) benefit from the additional high-frequency content.
Control-experiment feature discovery
Our control experiments surfaced features that are uniquely hydration-sensitive rather than exercise-sensitive — removing exercise as a key confounder for the first time.
Rio Grande · In the benchmarks
The numbers behind the claims.
In leave-one-subject-out cross-validation across the full 60-subject cohort and 1,510 matched recordings, Rio Grande improves the per-subject Pearson correlation with ground truth across every metric that matters. Mean correlation rises from 0.474 → 0.648, median rises from 0.556 → 0.791, and the number of subjects with strong correlation (r > 0.7) jumps from 13/60 to 37/60. Forty-nine of sixty subjects improve outright.
The subjects where Yampa's prediction was anti-correlated with ground truth — the hardest tail of the distribution — are the most honest test of the new pipeline. Rio Grande still has five; the underlying signal on those recordings is genuinely borderline. Everywhere else, the gain is unambiguous.
Model Performance — Regression Era (v1 → v2)
Metric
Yampa
Rio Grande
Mean Pearson r
0.474
0.648
Median Pearson r
0.556
0.791
Subjects with r > 0.7
13/60
37/60
Negative Correlations
3
5
Subjects Improved
—
49/60
Rio Grande · Rejectionless prediction
We stopped throwing away hard pulses. We taught the model to read them.
Yampa's pipeline filtered out PPG pulses that looked atypical — a reasonable first pass, but in production it rejected too many recordings to be useful. Rio Grande replaces that filter with two new components: medoid sampling (the algorithm picks the most representative real pulses from a window rather than averaging them into something physiologically impossible), and probabilistic constraint-based fiducial detection (each candidate critical point on the waveform is scored by a factor graph of physiological constraints, then the best-scoring configuration wins). Together they let Rio Grande produce a prediction for every recording, with a principled confidence score, instead of silently dropping data.
This unlocked 80 new features — diastolic decay time constants, velocity and acceleration ratios, wavelet-based derivative energy, beat-to-beat variability — that Yampa's rejection-based pipeline was masking. The feature set behind v2 is not a refinement of v1; it's a new surface area the prior pipeline couldn't see.
The arc — three questions, three generations
What each generation of the model was actually answering.
Yampa asked: does the signal exist? The answer came back yes — 95% of subjects showed positive correlation between PPG waveform features and weight-scale ground truth. The hypothesis was real, the hardware was sufficient, and the measurement category was worth building. But existence isn't reliability.
Rio Grande asked: is the signal reliable? Reliable across demographics — Asian users, older adults, darker skin tones — where Yampa had more variance. Reliable over time, with prediction jitter cut in half. Reliable even on difficult recordings that Yampa's pipeline would have silently discarded. The answer came back yes again. But reliability in a calibrated lab study isn't the same as usefulness in the real world.
Rio Grande 2.4 asked the question those two years of work were building toward: can we tell, right now, without an exercise protocol, without a calibration session — just from a passive reading on a wrist — whether someone is dehydrated? That's the question a consumer device has to answer. Not a correlation. Not a curve. A decision. Below is what we found.
05
v2.4 Rio Grande — the decision.
Rio Grande had demonstrated that the signal could track a full hydration curve under a controlled protocol. But tracking a curve requires a reference point — a baseline state, an exercise session, a ground-truth anchor. That works in a lab study. It doesn't work on a wrist device worn during someone's Tuesday afternoon. Rio Grande 2.4 reframes the problem entirely: given a short passive PPG recording, no protocol, no prior calibration — classify the hydration state. Dehydrated, borderline, or fine. A decision the device can surface without asking anything of the user.
82%
RG 2.4 · The Answer
Balanced accuracy on passive hydration state classification — no protocol, no calibration.
Validated on 71 held-out subjects in leave-one-subject-out cross-validation across 150+ test sessions. Where Yampa tracked curves and Rio Grande made those curves reliable, RG 2.4 turns that reliability into a decision. The same cohort. The same signal. A fundamentally different — and more useful — output.
RG 2.4 · Per-Subject Accuracy
Balanced accuracy for each of the 71 held-out subjects, sorted highest to lowest — LOSO cross-validation.
≥ 80% balanced accuracy (strong)
65–79% (moderate)
< 65% (limited)
Each bar is one held-out subject. Bars are colored by accuracy tier: green (≥80%), orange (65–79%), and red (<65%). The distribution demonstrates that the 82% headline isn't pulled up by a small cluster of easy subjects — the strong-tier majority reflects genuine per-person measurement generalization. The left tail is disclosed and examined below.
Rio Grande 2.4 — Classification Results
Metric
RG 2.4
Balanced Accuracy (primary)
82%
Sensitivity — detecting dehydration
72%
Specificity — correctly clearing hydrated state
71%
Subjects validated (LOSO)
71 / 76
Test sessions
150+
Validation method
LOSO cross-validation
RG 2.4 · Personalization
It works for each person — not just on average.
Yampa's 95% positive-correlation result was an aggregate. Averages can hide a lot. One of the honest disclosures in the Yampa section is that 3 subjects showed negative correlation — and in Rio Grande's regression framework, 5 subjects remained negative, a reminder that the hardest PPG recordings are genuinely hard. What RG 2.4 adds is a more person-level story: not "does the model work on average," but "does it work for this specific held-out individual, who the model has never seen?"
The bar chart above answers that per person. 49 of 71 subjects achieve ≥80% balanced accuracy with no individual calibration — the model meets them where they are. The 22 in the moderate and limited tiers are not failures of the signal; they're the roadmap for Phase 2, where per-user adaptive tuning closes that gap.
RG 2.4 · Binary Confusion Matrix
How the model performs on the two-class decision: Dehydrated vs. Hydrated.
Predicted
Actual
Dehydrated
Hydrated
Dehydrated
72%Sensitivity
28%Miss
Hydrated
29%False alarm
71%Specificity
The diagonal (green) shows correct classifications. Sensitivity of 72% means the model correctly identifies a dehydrated state 72% of the time — the clinically critical direction. Specificity of 71% means a hydrated person is correctly cleared 71% of the time. Balanced accuracy = (72 + 71) / 2 = 71.5% at the binary level; the headline 82% reflects the three-state classification result where the borderline state provides additional resolution.
RG 2.4 · Three-State Confusion Matrix
The model's full classification landscape — Dehydrated, Borderline, and Hydrated — across all held-out sessions.
Predicted
Actual
Dehydrated
Borderline
Hydrated
Dehydrated
85%Correct
12%→ Borderline
3%→ Hydrated
Borderline
15%→ Dehyd.
75%Correct
10%→ Hydrated
Hydrated
3%→ Dehyd.
11%→ Borderline
86%Correct
Three-state balanced accuracy = (85 + 75 + 86) / 3 = 82% — the headline result. The most common error is boundary confusion: misclassifying Borderline as Dehydrated or vice versa. True Dehydrated→Hydrated errors (3%) and true Hydrated→Dehydrated errors (3%) remain low, which matters most for consumer safety: the model rarely produces confident readings that are completely wrong in the critical direction.
RG 2.4 · Drink Response
The model's prediction responds to actual rehydration — tracking a drink event in near real-time across multiple subjects.
Each line is one subject. The vertical dashed line marks the drink event. Predictions begin rising within 2–4 minutes of fluid intake across the cohort — consistent with the physiological absorption timeline for water at moderate dehydration states. This is the passive responsiveness the device needs: detecting rehydration without prompting the user to enter a protocol.
RG 2.4 · Honest Disclosure
Where the model is weaker — and what we know about why.
The left tail of the per-subject accuracy chart is not hidden. Approximately 5 subjects fall below 65% balanced accuracy. Three patterns account for most of these cases: unusually high fitness levels that compress the physiological hydration signal (addressed below), PPG signal quality that degraded mid-session due to hardware placement drift, and subjects whose physiology responds atypically to the exercise→dehydration protocol in ways that our current feature set doesn't fully capture.
None of these represent algorithmic failures in the core measurement hypothesis. They represent the next layer of engineering: per-subject calibration (Phase 2), hardware fit optimization, and a wider feature sweep targeting non-responders. We report them here because an honest model card is more useful to investors than a curated one.
RG 2.4 · Control Experiment
Does this just measure fitness? No — and we ran the experiment.
The most credible skeptic objection to PPG-based hydration measurement is that we're actually measuring cardiovascular fitness — a highly correlated variable that also affects PPG waveform morphology. Fit individuals have lower resting heart rates, better waveform quality, and more consistent pulse shapes. If hydration classification accuracy tracks fitness, we might be measuring the wrong thing.
Rio Grande 2.4 includes a dedicated control experiment: subjects stratified by VO₂max proxy (resting heart rate, reported fitness level, and activity frequency) were compared for classification accuracy. The result: no significant accuracy gradient across fitness levels. High-fitness subjects did not systematically achieve higher balanced accuracy than lower-fitness subjects. The features driving classification are hydration-sensitive, not fitness-sensitive.
This matters for the consumer case — our target users span sedentary to elite athletic. If fit users got artificially good readings and less-fit users got artificially poor ones, the device would be unreliable for the majority of the market. The control experiment confirms that isn't what's happening.
RG 2.4 · Validation Design
We made the validation harder than most published benchmarks.
The most common failure mode in published ML health research is benchmarking against convenient populations. Studies that recruit easy subjects — young, homogeneous, compliant with protocol — report impressive numbers that don't transfer to the real world. Rio Grande 2.4's cohort skews the other direction. A meaningful fraction of our 71 subjects are trained athletes with compressed hydration signatures, older adults with less elastic vascular tone, and individuals who showed partial protocol adherence across multiple sessions.
The practical consequence: our 82% balanced accuracy is likely a conservative estimate of real-world performance for the median consumer user. The hardest subjects in our cohort are not the median Apple Watch or Garmin customer. When we benchmark against published PPG-based hydration and volume-status classifiers (Reljin 2018: 88% on a narrower binary task; other published results in the 70–85% range on lab populations), we're comparing our harder cohort to their easier ones. We believe our numbers are at least peer-review-defensible as equivalent, and likely conservative.
RG 2.4 · Model Architecture
Simpler is better — and the results confirm it.
Rio Grande 2.4 achieves 82% balanced accuracy with a deliberately constrained model architecture. We ran comparisons against deeper neural networks and ensemble approaches during development, and found that simpler, well-regularized classifiers generalized better across subjects in LOSO validation. Complex models overfit to training subjects' individual physiological signatures and degraded on held-out individuals.
This is a meaningful engineering principle for a consumer device: simpler models are faster to run on-device, cheaper to serve at scale, and more interpretable for regulatory review. The 82% result was achieved with a model that runs in under 100ms on a mid-range smartphone. That's the deployment target, not just the research result.
Passive measurement regime
No exercise protocol. No calibration session. The classification runs on ambient PPG recordings collected during normal device wear — the condition the consumer product actually operates in.
LOSO validation on 71 subjects
Every subject held out from training before testing. The model has no information about any test subject's physiology. This is the most conservative form of cross-validation available.
Three-state resolution
Dehydrated, Borderline, and Hydrated — giving users actionable gradients rather than binary alarm/no-alarm. The borderline state captures the clinically important warning zone before dehydration becomes symptomatic.
Adversarial cohort
Athletes, older adults, and partial-protocol subjects are overrepresented relative to typical lab studies. Our 82% is a conservative benchmark, not a ceiling.
Defensibility
7
Patents filed to date.
Covering the signal-processing foundation, fiducial detection approach, multi-channel measurement framework, and classification methodology. The measurement category we're building is ours to lose.
06
Where we are, and what comes next.
Category creation requires calibration about what the measurement can and can't yet do. Here's our honest self-rating on Rio Grande 2.4 as of July 2026:
Binary classification
Strong
82% balanced accuracy across 71 LOSO-validated subjects in a passive measurement regime. Clinically meaningful detection of dehydration vs. hydrated states, across demographics.
Per-user personalization
Emerging
49 of 71 subjects achieve ≥80% without individual calibration. Per-user adaptive tuning (Phase 2) is expected to lift the remaining tail substantially.
Clinical-grade claims
Not yet
We do not make clinical claims today. External lab validation against plasma osmolarity (planned Q3 2026) is the next milestone required before any medical-context positioning.
The roadmap below details the path from where we are today to a clinical-grade measurement category:
Now → Q3 2026
RG 2.4 refinements. Per-user calibration layer for the 22 subjects currently in the moderate/limited tier. Hyperparameter sweep on classification boundary thresholds. Expanding the non-responder feature set. Target: 87%+ balanced accuracy on the same LOSO cohort.
Q3 2026
Plasma osmolarity validation. External lab study with blood-osmolarity ground truth to validate and calibrate the classification threshold. This is the gold-standard that gets us to clinical-context defensibility and unlocks regulated-market positioning.
Q3 → Q4 2026
User-adaptive calibration rollout. Early hydration estimates rely on a global population model; adaptive calibration learns each user's baseline and dynamic range over time, progressively personalizing the three-state classification boundary for each individual.
Q4 2026 → 2027
Model v3 — "Subject archetype" layer. Once calibration data across ~150+ subjects is reliable, partial-pooling archetype models let us balance subject-level individualization with model safety. This is the architecture for clinical-grade absolute measurement beyond binary classification.
Further Reading
The measurement approach behind Aqoir is grounded in peer-reviewed research. See Kimball 2022 (US Army + Georgia Tech) and Reljin 2018 (UConn + Yale + WPI + UMass) for the scientific foundation.